
For the best experience, rotate to portrait mode.
Viewing in landscape mode on iPads, mobiles, Apple Vision Pro, and foldable devices may not provide optimal viewing experience.


BUSINESSES

Sugar

Alcohol

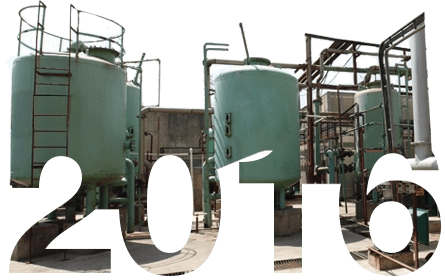
Water Solutions
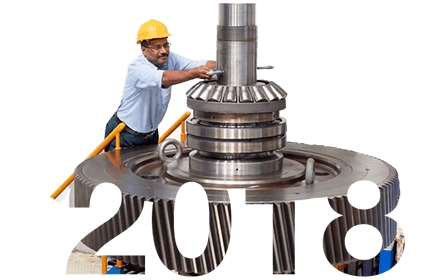
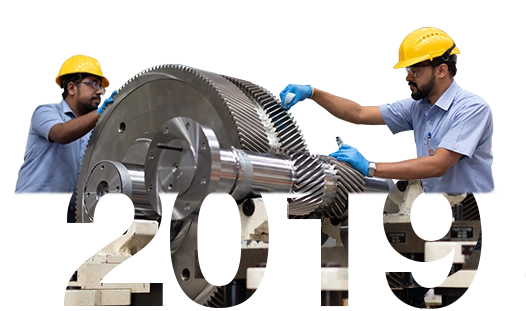
Power Transmission

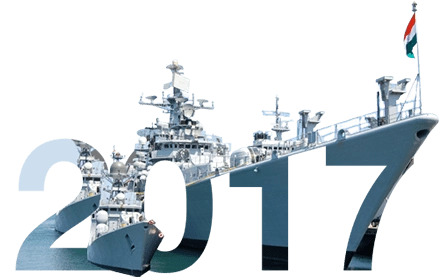
Defence


PERFORMANCE
Rs.5,616.8 cr
Revenue from Operations (Net of excise duty) FY 23
2.9 x
Revenue from operations (Net of Excise Duty) FY 16-23
4.9 x
EBITDA FY 16-23

Working Towards Building A Better Future
Join Us
Triveni brings together the best of diverse worlds; we are a fast-growing conglomerate with market leadership across businesses and a culture that emphasises the constant development of every individual. The end objective for everyone is to attain personal milestones and contribute to winning teams.
8th Floor, Express Trade Towers, Plot No. 15 & 16,Sector 16-A, Noida - 201301, India.
+91-120-4308000 +91-9818585821
© 2024 Triveni Engineering & Industries Ltd.